
Ethereum VS Solana | Data on Wallets, Transactions, Fees, TVL and Marketcap | Aug 2025
7 comments
Solana has become the number one challenger for Ethereum. The chain has gone through a real roller coaster, a sharp collapse two years ago after the FTX saga, and a major recovery in 2024.
At one point in the recent months it claimed to the third position on the market cap rankings, just after BTC and ETH. It has dropped since, but it is still up there in the top.
How are the two major chains doing in the last period? Let’s take a look.
The two chains have a different approach. Ethereum has now clearly pivoted to L2 solutions for mass adoption. Solana on the other hand is going L1 first approach, trying to incorporate all the apps on layer one while keeping the fees low. This obviously comes at a cost as there is a need for a big and expensive infrastructure for this.
We will be looking at data for:
- TVL
- Active wallets
- Number of daily transactions
- Fees
- Market cap
The data is extracted from , DefiLama, Dune Analytics, the Block etc.
Ethereum has been around since 2015, while Solana started operating in 2020. Because of this the period that we will be looking at is
TVL
How is the Total Value Locked doing? This is a metric that usually represents the amount of outside capital stored in DeFi protocols on chains. Here is the chart.
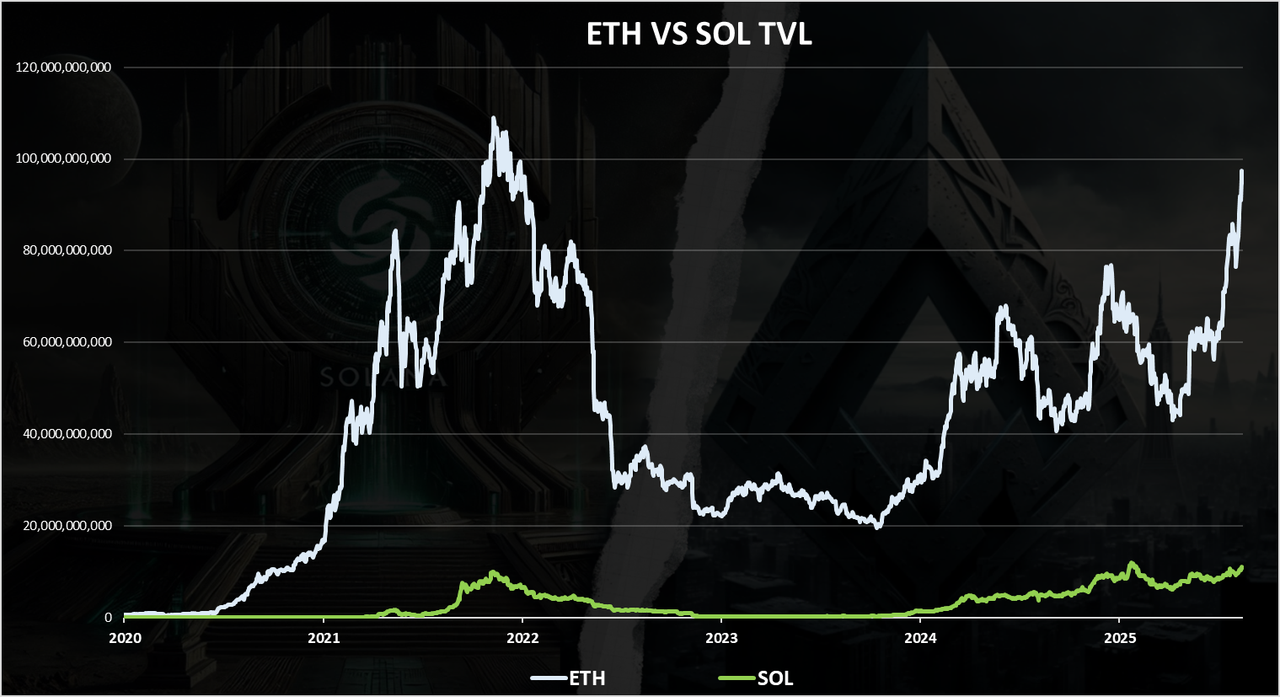
When it comes to TVL, Ethereum is leading by a lot. At the moment ETH is close to 100B in TVL while Solana is around 11B.
We can notice the recent spike in the TVL on Ethereum due to its price increase. Ethereum is now close to 100B for the first time since 2021. Its been a long time. It still haven’t reached its previous ATH that is around 110B but it is very close now.
Solana has increased its TVL as well, but only slightly and close to its previous ATH as well.
Active Wallets
How many wallets are being used? Here is the chart.
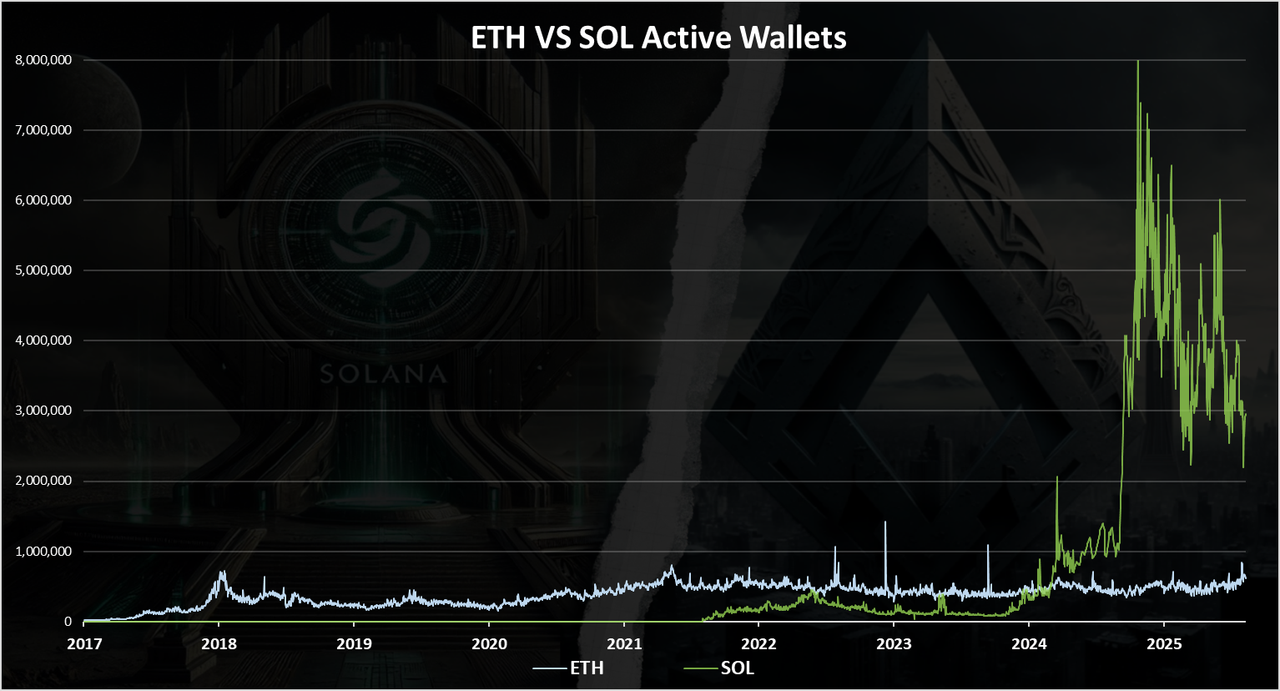
The number of active wallets have clearly growth a lot on the Solana chain and has surpassed Ethereum by a lot in 2024. At one point Solana had 8M DAUs, while on Ethereum network the number of active wallets has been in the range of 300k to 500k DAUs.
In the very last period we can notice that the number of DAUs on Solana have dropped, while there is a slight increase on Ethereum. A 3M on Solana VS 600k on Ethereum. Still a big lead for Solana.
We should have in mind that the fees on Solana are much cheaper than Ethereum and there is a lot more bots running there. This affects DAUs and transactions as well.
Number of Daily Transactions
Here is the chart for the number of daily transactions.
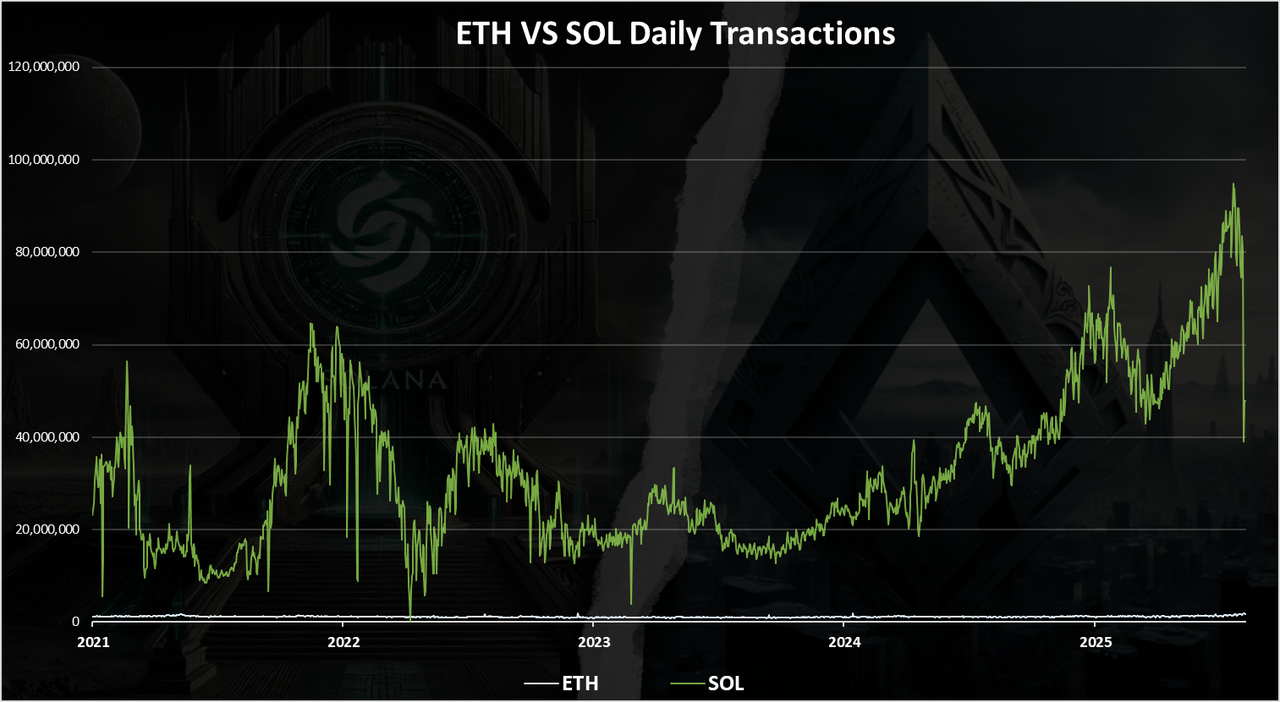
In terms of daily transactions Solana is absolutely dominant. Ethereum has around 1.5 to 1.8M transactions and the line for the number of transactions on ETH is down and almost flat on the chart.
Solana is known to be fast and cheap, and the number of transactions has reached 90M recently and dropped to around 40M where it is now.
Again we should have in mind the cheap fees on Solana that can drive a lot of bots and spam transactions.
Fees
The chart for the fees looks like this.
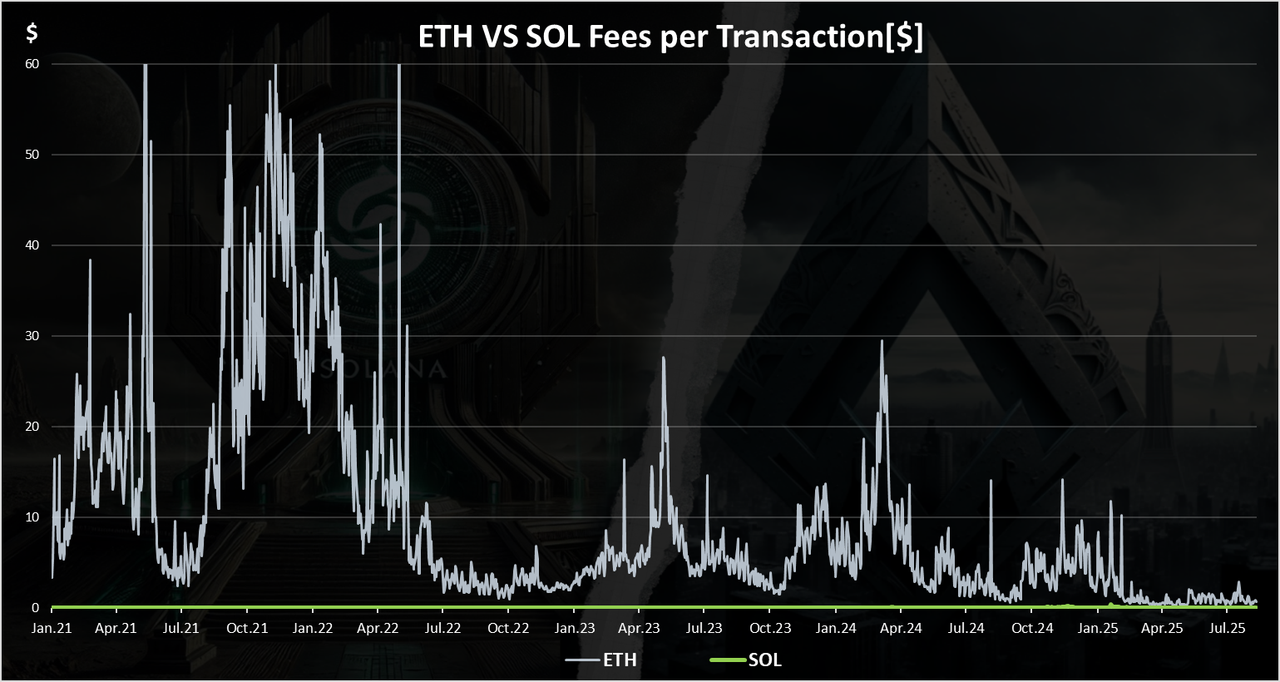
These are the average daily fees per transaction in $ value.
In terms of fees the line for Ethereum is clearly visible while the line for Solana is on the bottom of the chart. Fees on Ethereum have been volatile, going up to 50$ from a few dollars.
What’s interesting is that in the recent period the fees on Ethereum have dropped under one dollar for the first time after a while.
But even this is high compared to fees on Solana where they have been less than a cent for most of the period. In 2024 though the fees on Solana have increased a bit and are now around one cent, 0.01$.
Ethereum VS Solana Market Cap
The interesting topic for Ethereum VS Solana is will Solana overtake Ethereum at some point?
Here is the historical chart for the Ethereum VS Solana market cap.
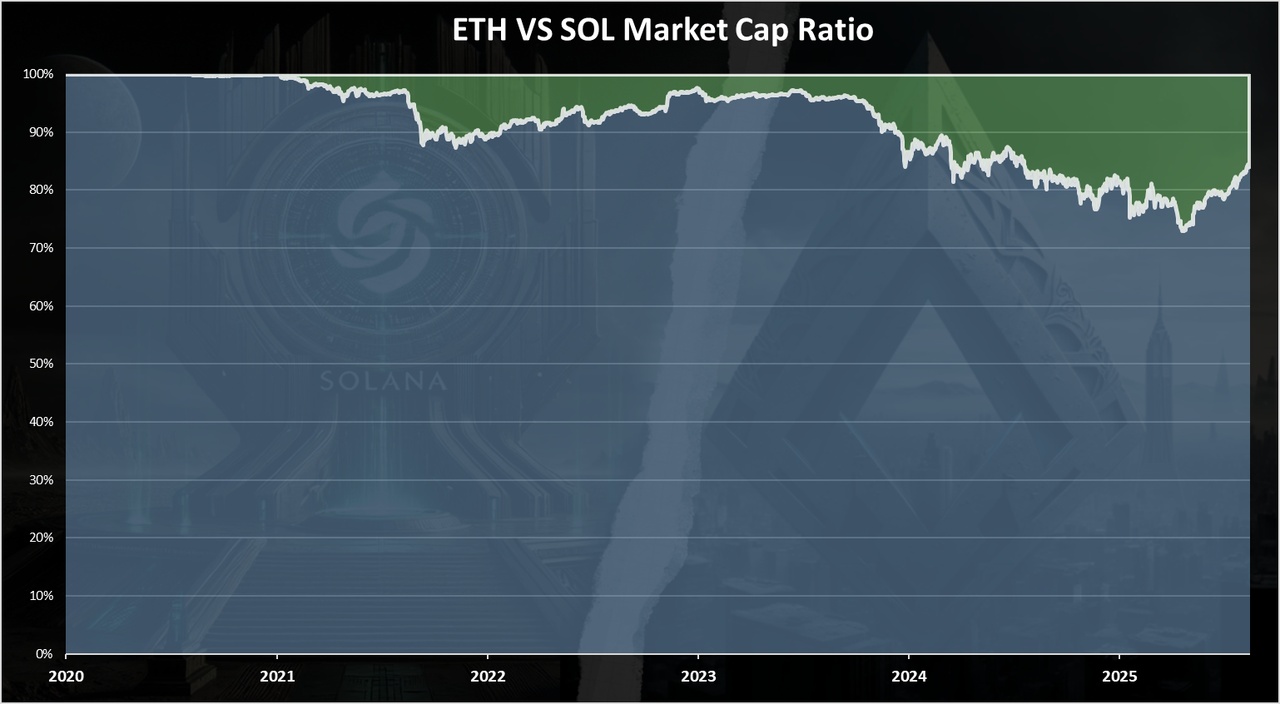
Ethereum is obviously dominant when it comes to market cap.
We can notice that after a period of positive trend for Solana, where it has increased its market share from 2023 to 2024, in the last weeks Ethereum has reversed this trend for the first time after a while.
At the moment Solana is at all time high when compared to Ethereum with 16% of the share. At one point it was close to 26%.
Here is the chart how the ratio of the market cap between the two looks at the moment:
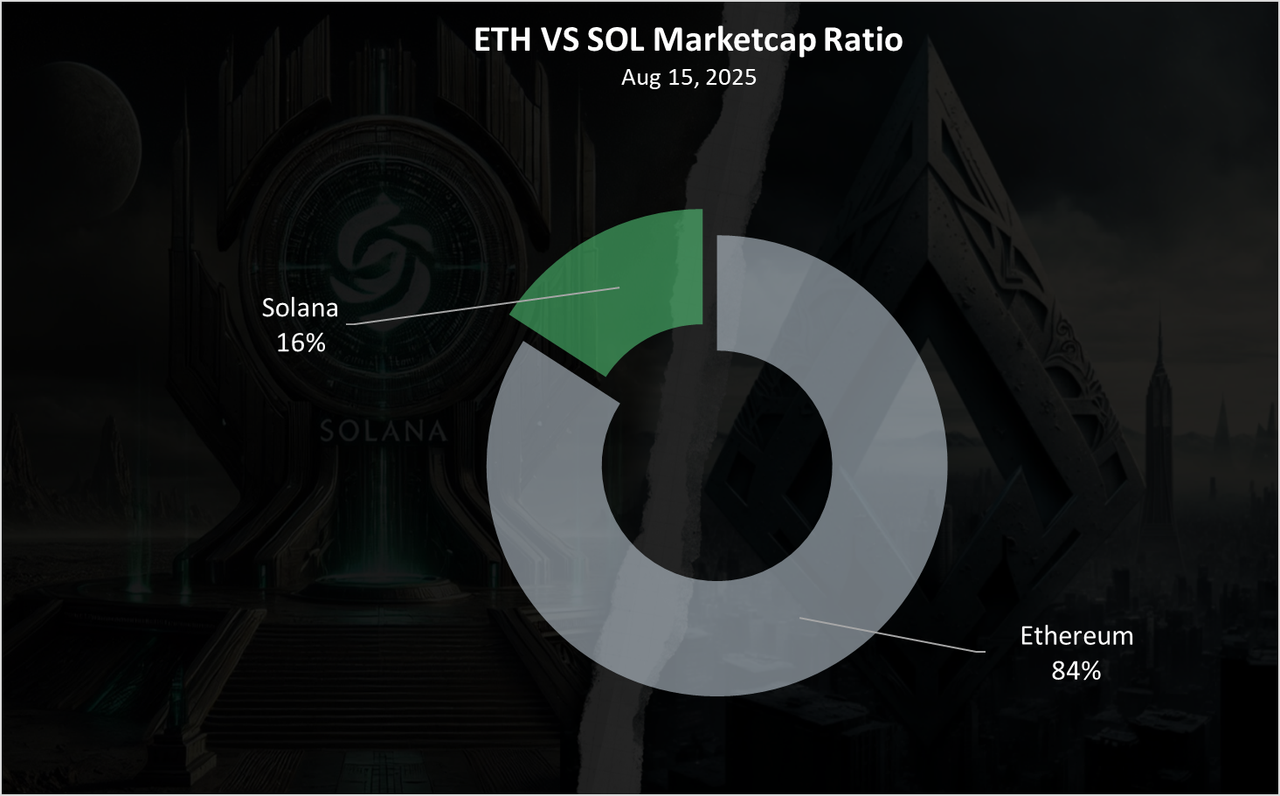
An 84% for ETH, and 16% for Solana. Ethereum is obviously in lead here by a lot.
From all the above it’s obvious that Solana has gain a massive traction in 2024 and overtook Ethereum in terms of active wallets, transactions etc. But in terms of capital Ethereum is still dominant by a lot, and in the last period it has reversed some trends in its favor after a long time.
All the best
@dalz
Comments